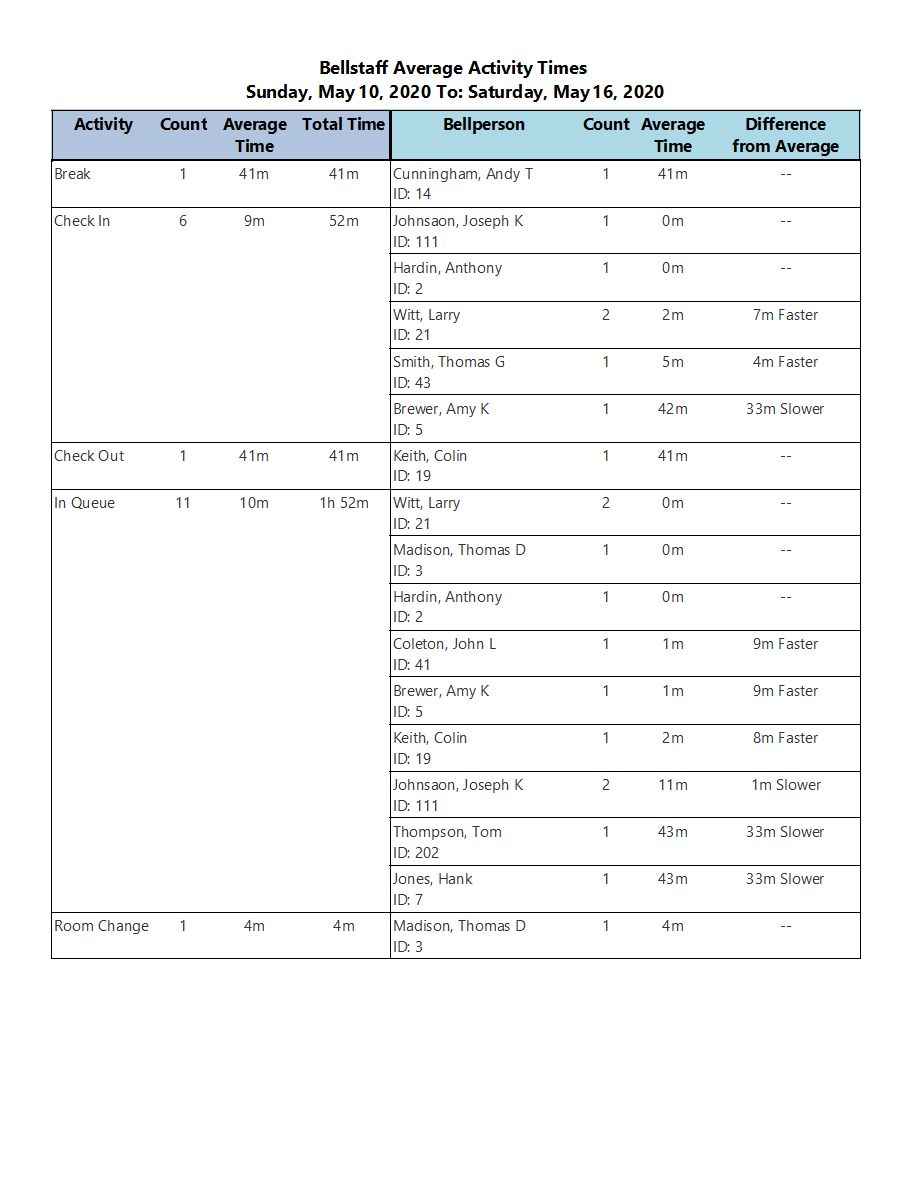
This is the first report in the Bellperson reporting series. The report is designed to show you, for each activity you created using the Activities Window, how many times this activity was performed, the average time for the entire bell staff, and the total time used by this activity. For each bell person that was assigned this activity, we can see how many times each bell person pertformed the activity, their average time, and how their times relate to the group. Each bell person is ranked according to how their average time to perform this activity differs from the average time for the bell staff for this activity.
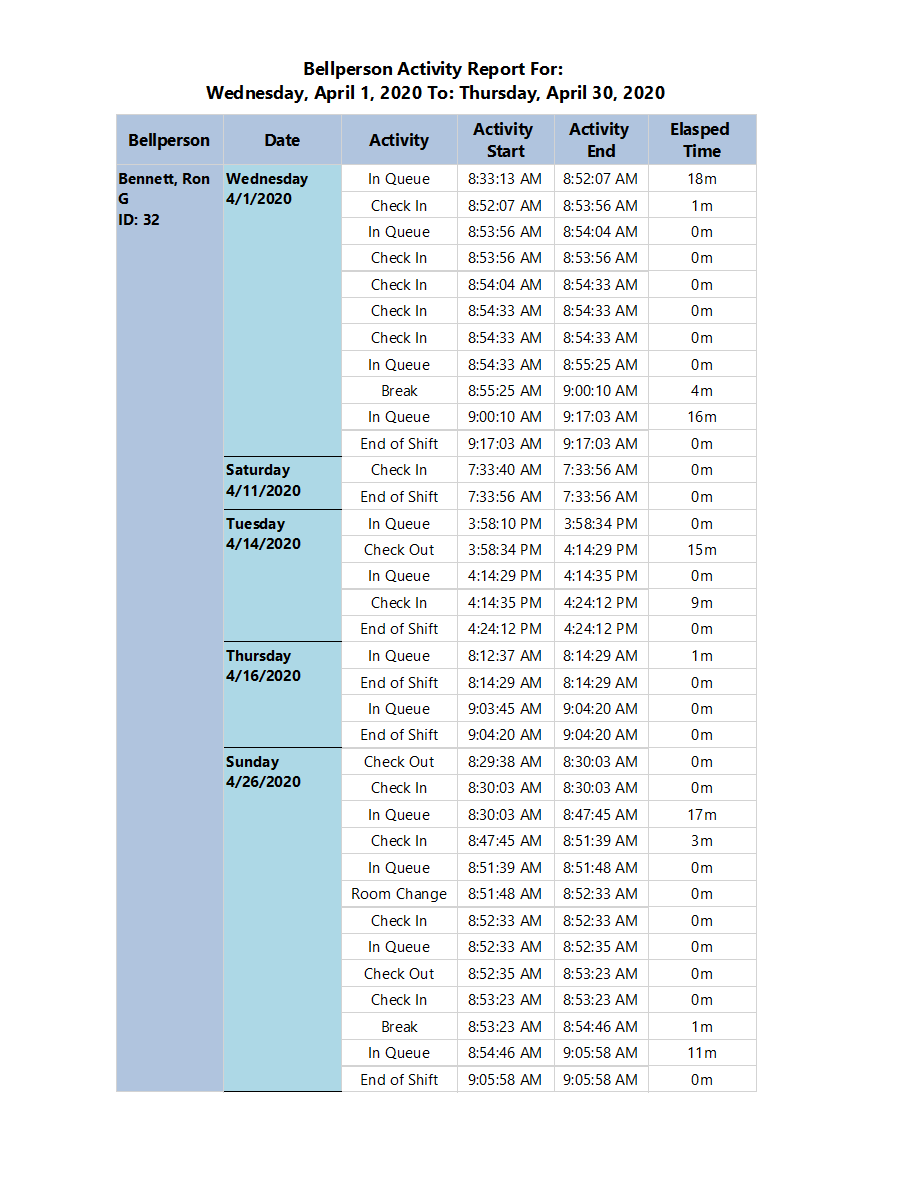
This report is designed to provide you with a detailed log of each bellperson activities throughout the day. You may select one bell person for this report or the entire bell staff. The bell person detail report is broken down by bell person, the dates, and each activity performed by the bell person. On the left, we see the bell person, then the date, and finally we have activites area. This area shows you each activity performed in chronological order with the time the activity was started, when it was finished, and how long the activity took.
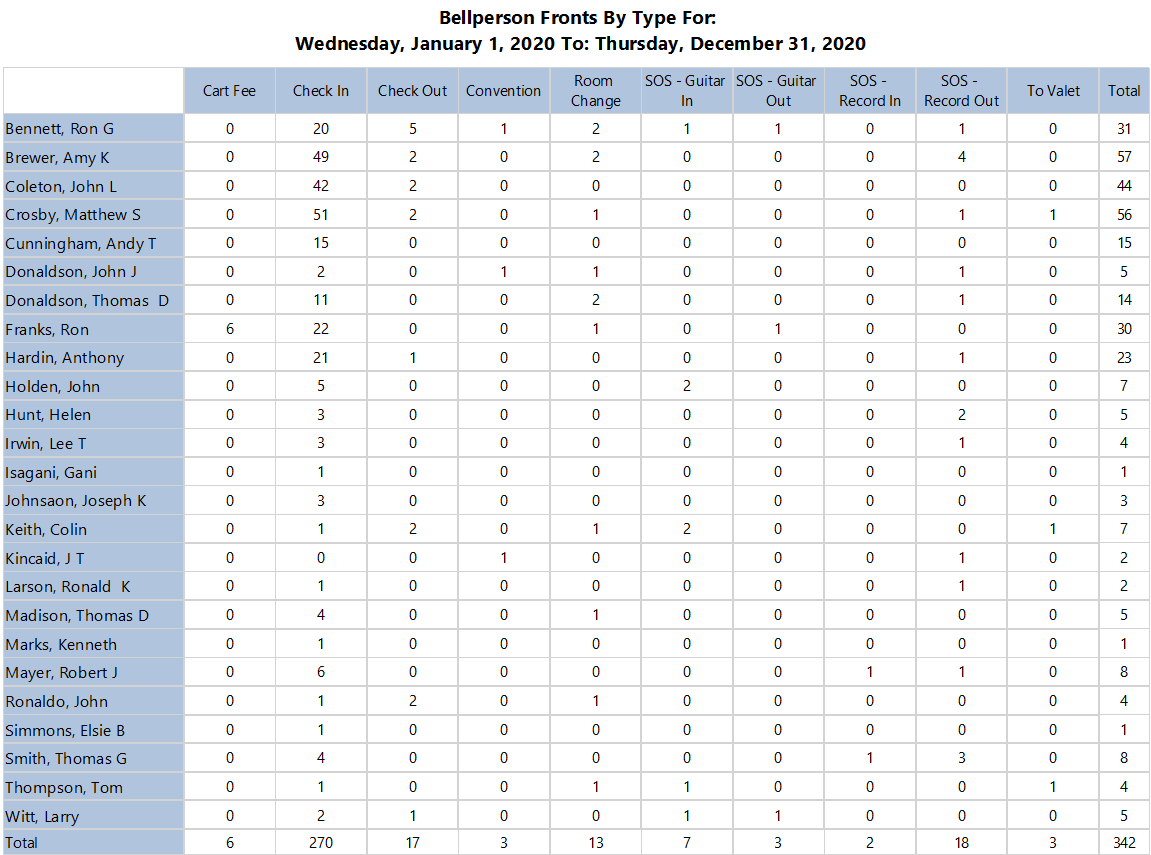
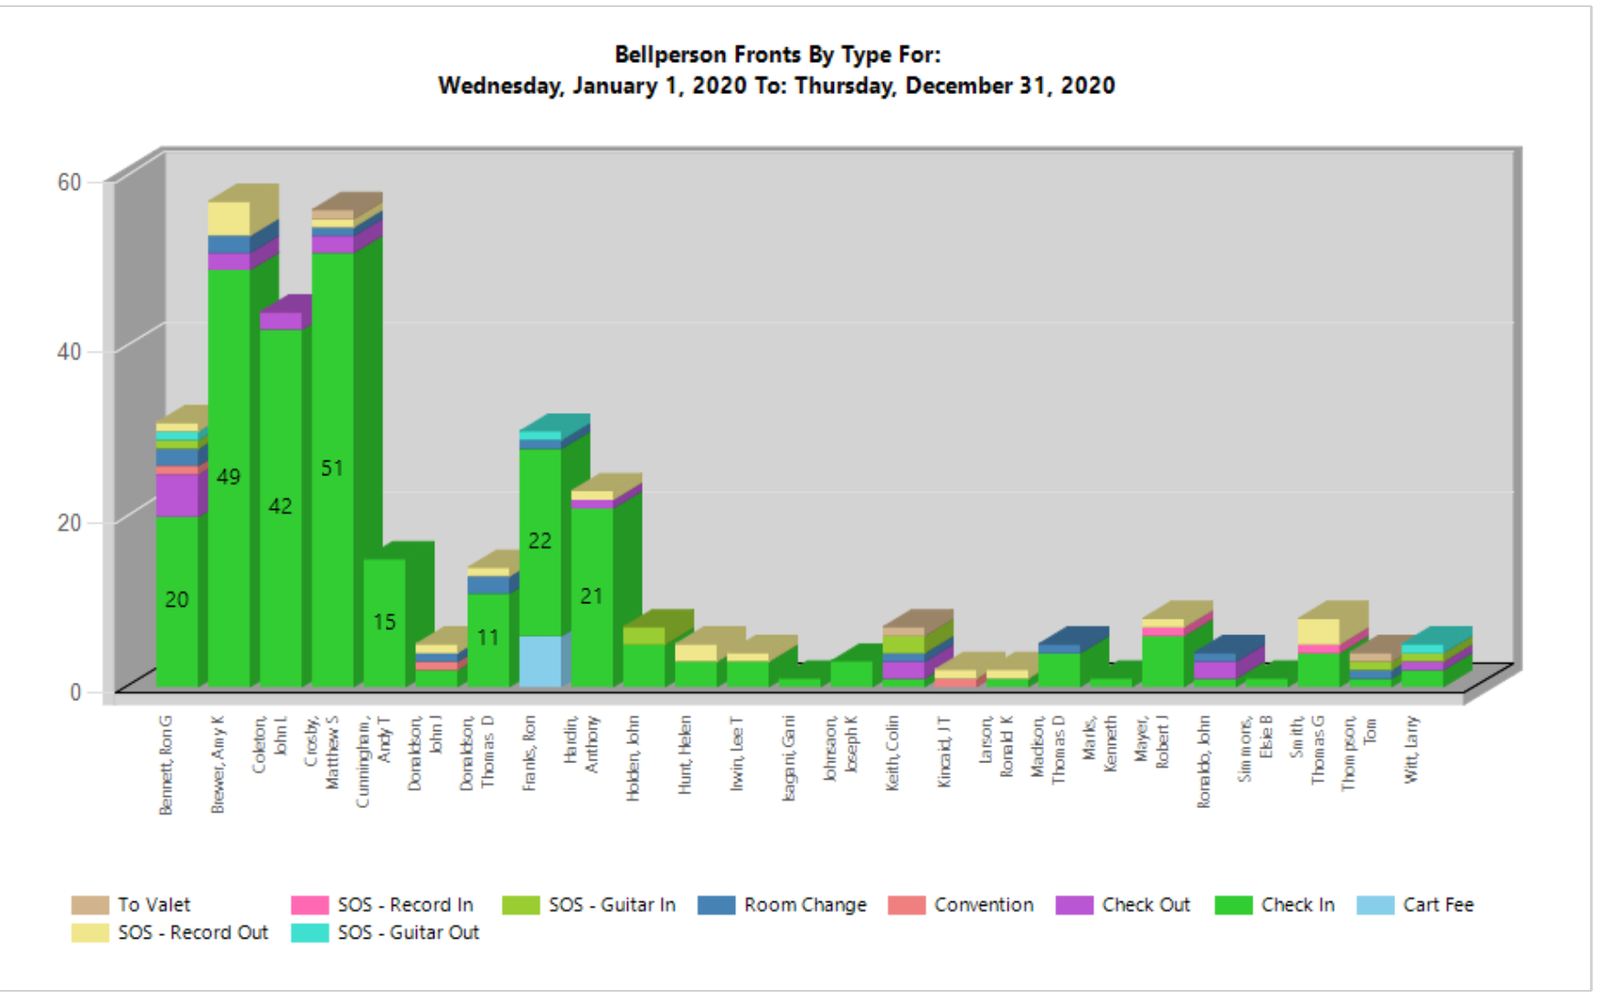
The bell person fronts by type report is designed to provide you with a list of each bell person, the total fronts that they have run for the specified time period, and a breakdown of each type of front they have run.
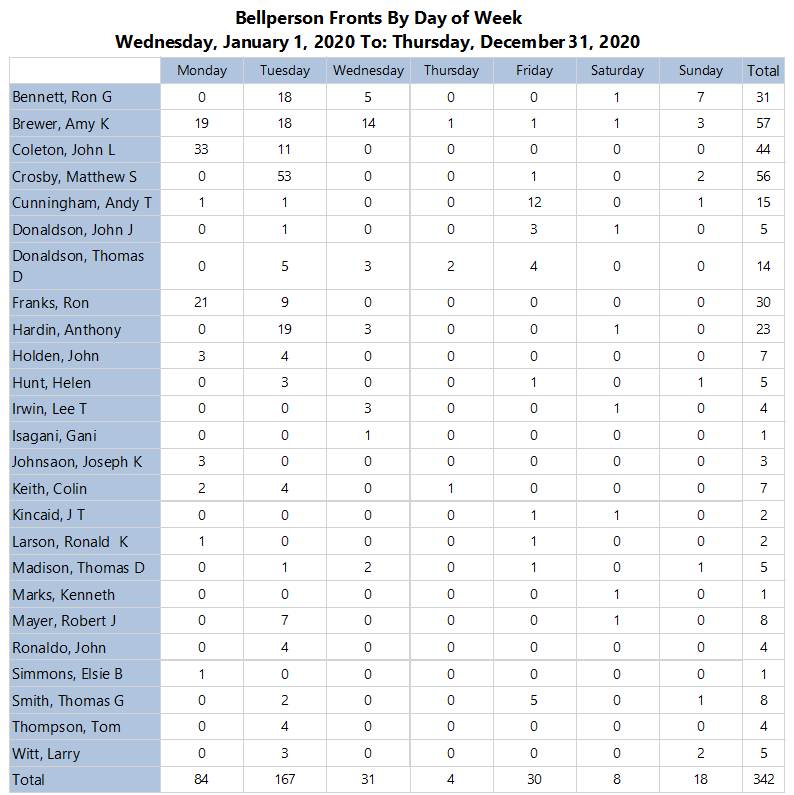
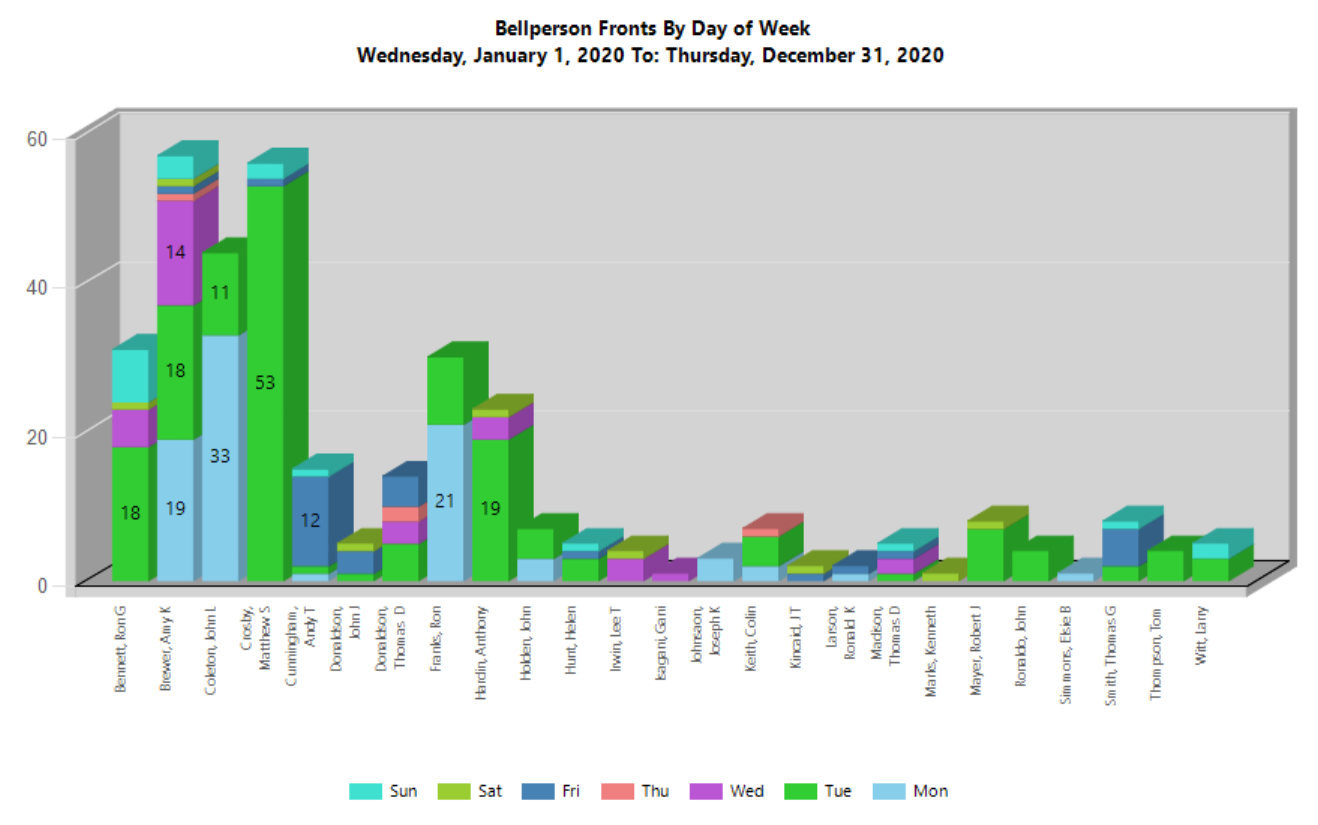
These reports is similar to the previous ones, but these reports breaks down the fronts each bell person has run by the day of the week.
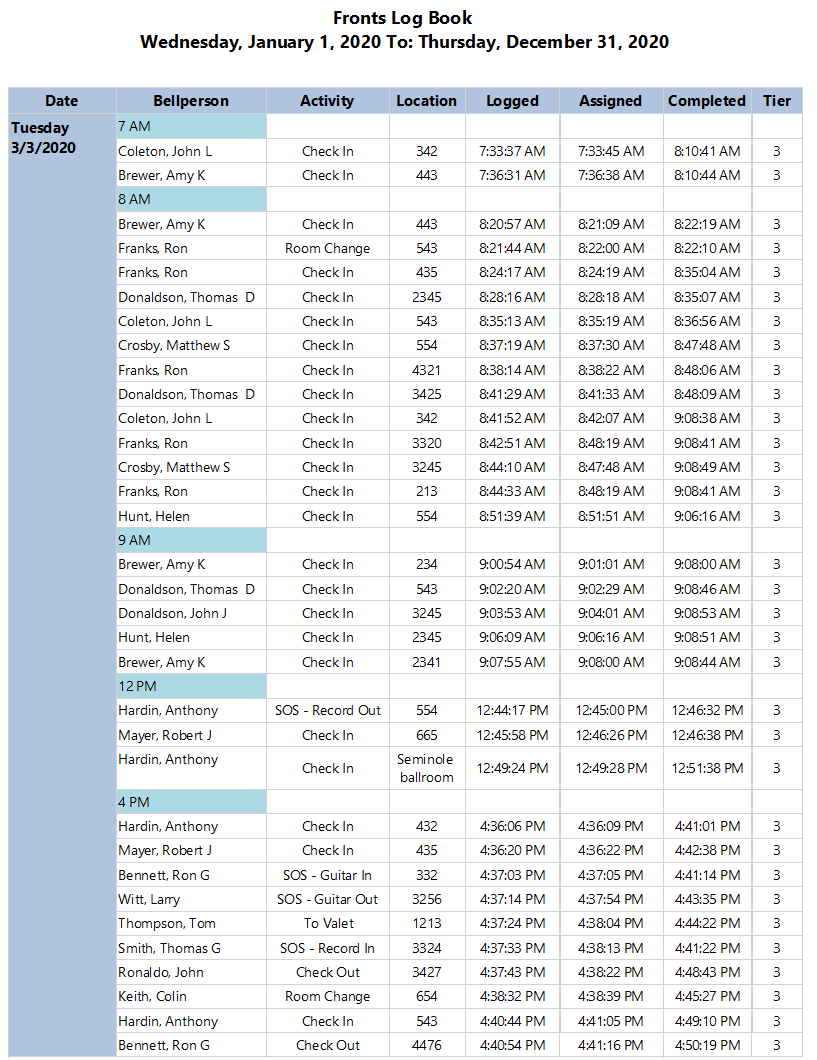
The first front report is simply the log book for the bell desk. This report is broken down for each day, then each hour of the day. It shows you the details of every front run by your bell staff. We can see who was assigned to the front, the type of front, where the front was run to, the time it was logged into the system, when it was assigned to the bell person, and the time the bell person completed the front.
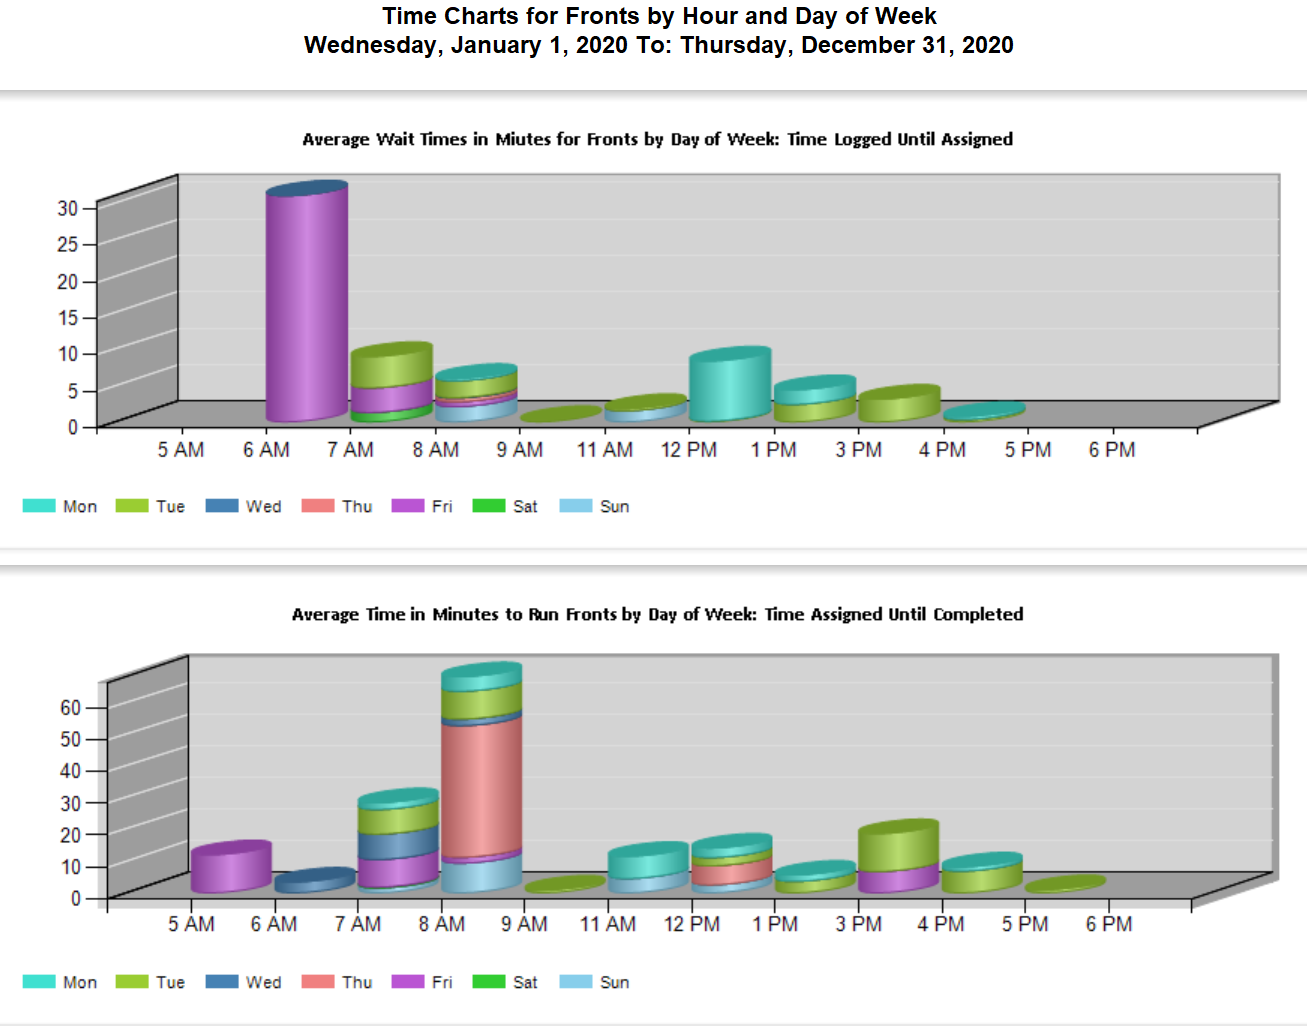
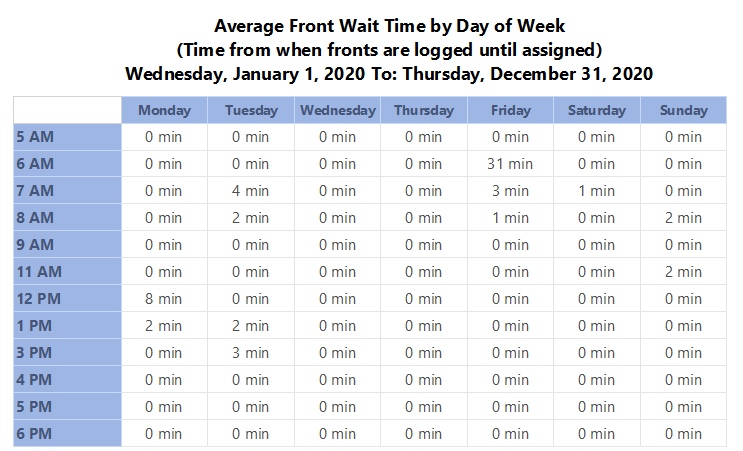
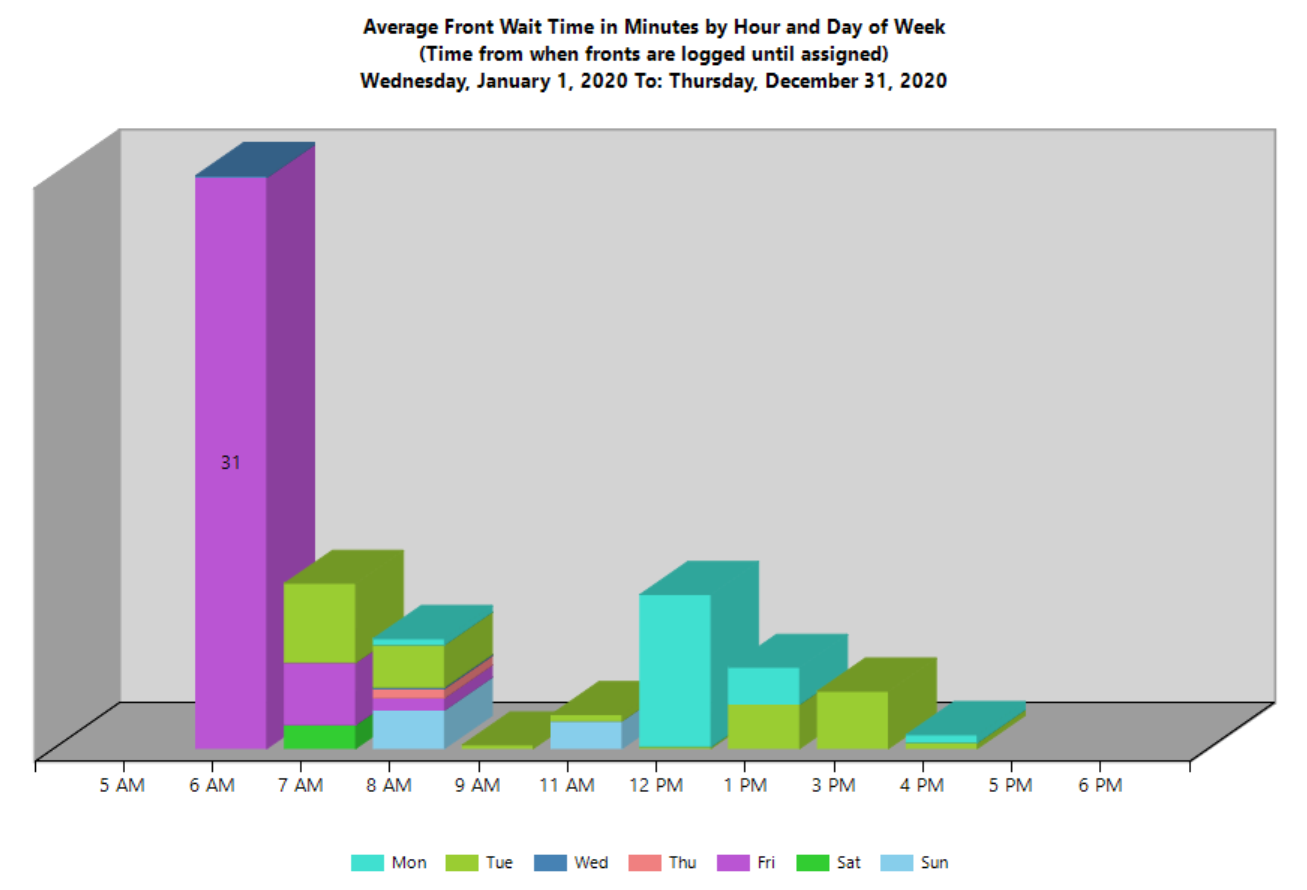
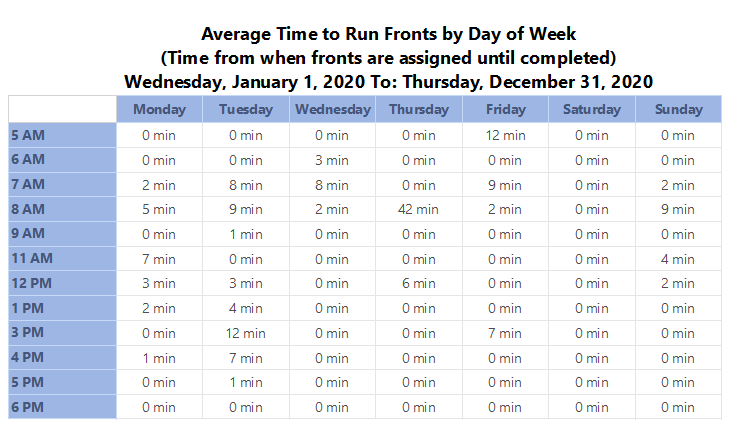
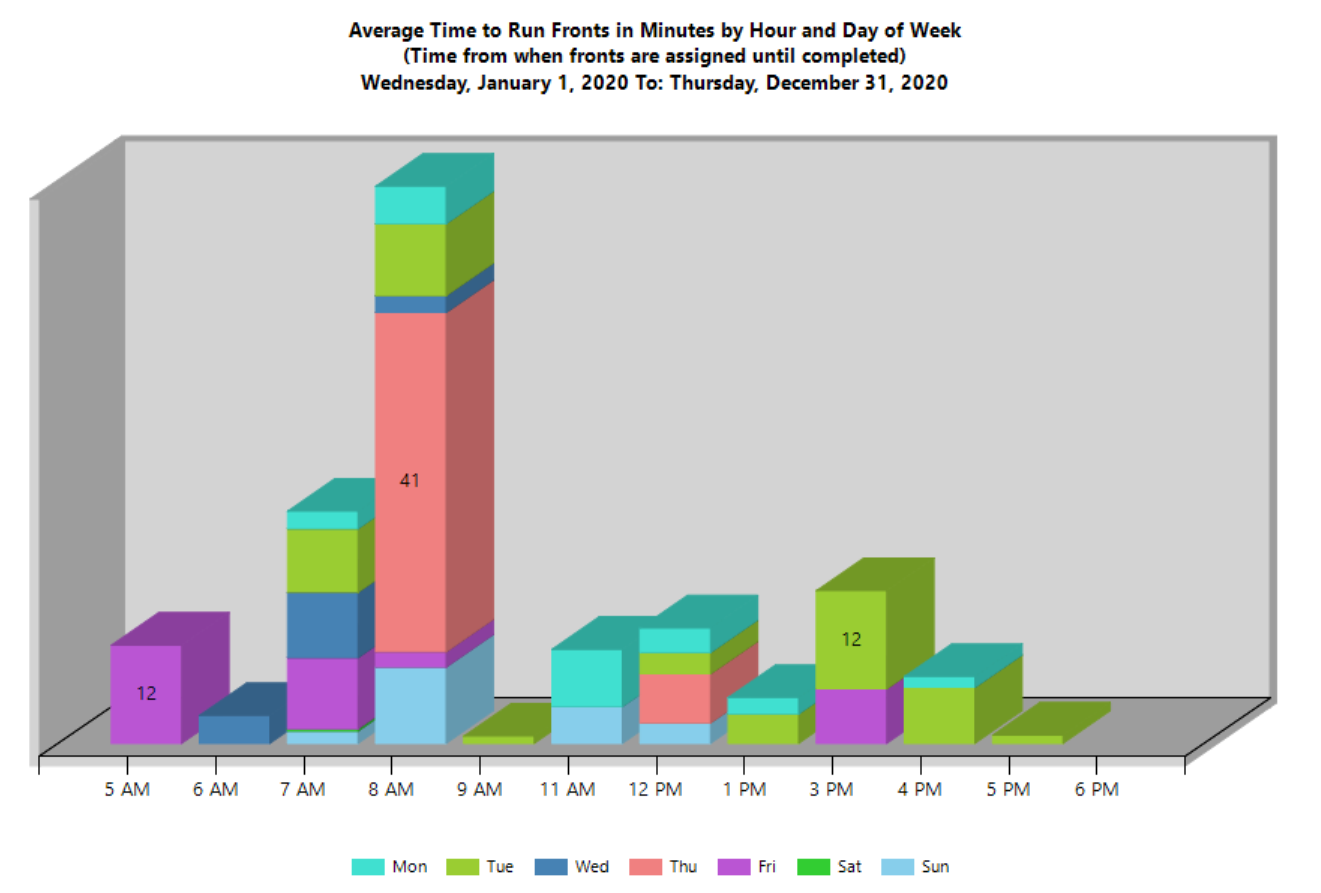
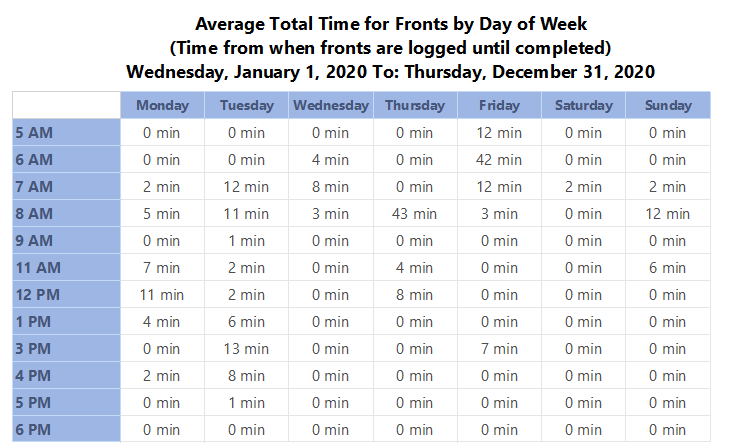
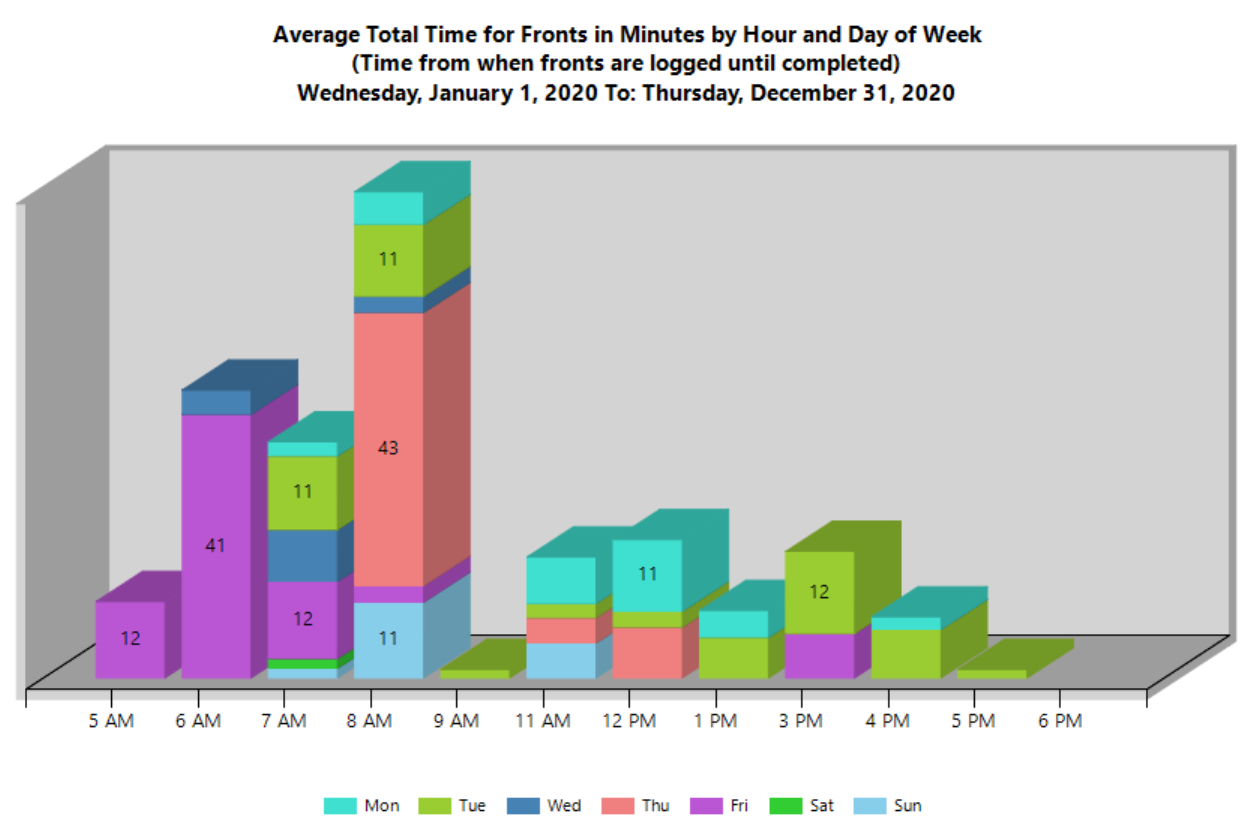
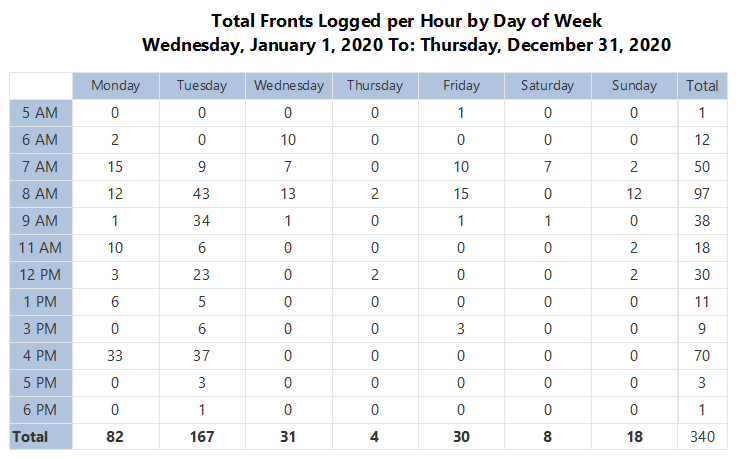
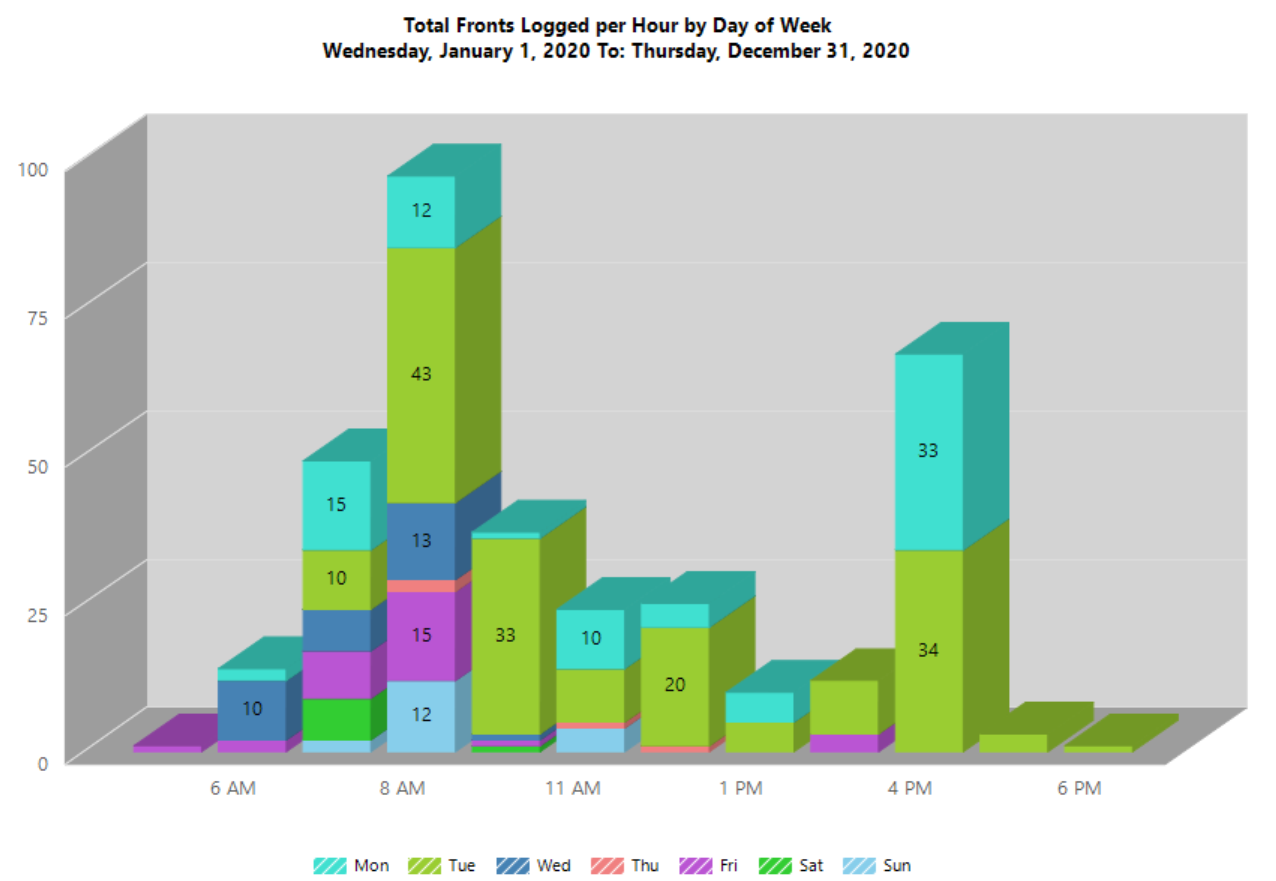
The fronts times chart report contains 4 charts that summarize how long it takes for each phase of running a front. First we have a chart that shows you the average wait time for fronts for each day of the week, and each hour of the day. This the time from when the front was logged into the system until it was assigned to a bellperson. Next we have a chat that shows you the average time to actually run the front. This is the time from when the front was assigned to a bellperson until the bell person completed the front. We also have a chart that shows you the time it took from the time the front was logged into the system until the bell person completed the front. Finally, we have a chart that will show you your total fronts run for each day of the week, and each hour of the day.
The wait times reports provide you with the data and a chart showing you how long fronts are waiting to be assigned to a bell person. This is the time from when the front was entered into the system until it was assigned to a bellperson. The report is broken down by day of week and hour of the day.
The run time reports provide you with the data and a chart showing you how long fronts are taking to be run by your bell staff. This is the time from when the front was assigned to a bellperson until it was completed. The report is broken down by day of week and hour of the day.
The total time reports provide you with the data and a chart showing you the total time fopr your fronts. This is the time from when the front was logged into the system until it was completed by the bell person. The report is broken down by day of week and hour of the day.